Note
Click here to download the full example code or to run this example in your browser via Binder
Matplotlib colormaps in Nilearn#
Visualize HCP connectome workbench color maps shipped with Nilearn which can be used for plotting brain images on surface.
See Surface plotting for surface plotting details.
import numpy as np
import matplotlib.pyplot as plt

from nilearn.plotting.cm import _cmap_d as nilearn_cmaps
from nilearn.plotting import show
Plot color maps#
nmaps = len(nilearn_cmaps)
a = np.outer(np.arange(0, 1, 0.01), np.ones(10))

# Initialize the figure
plt.figure(figsize=(10, 4.2))
plt.subplots_adjust(top=0.4, bottom=0.05, left=0.01, right=0.99)

for index, cmap in enumerate(nilearn_cmaps):
    plt.subplot(1, nmaps + 1, index + 1)
    plt.imshow(a, cmap=nilearn_cmaps[cmap])
    plt.axis('off')
    plt.title(cmap, fontsize=10, va='bottom', rotation=90)

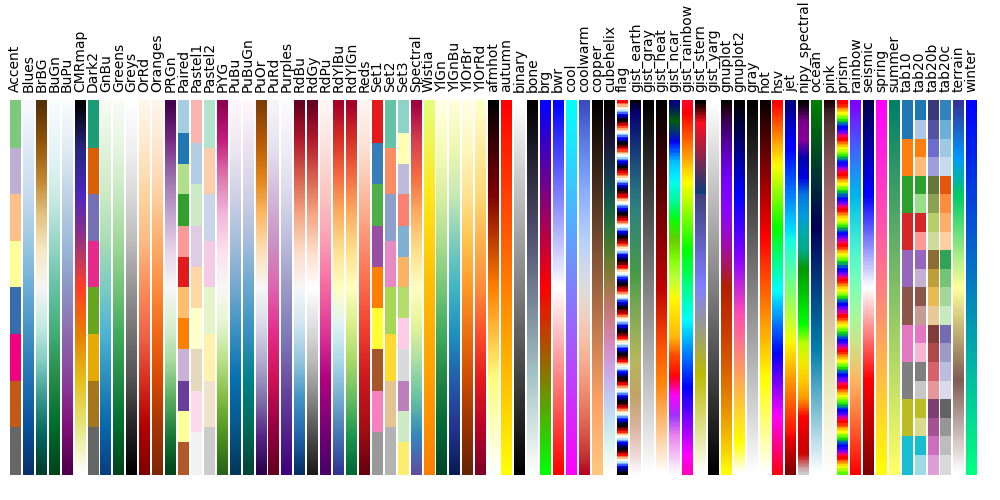
Plot matplotlib color maps#
plt.figure(figsize=(10, 5))
plt.subplots_adjust(top=0.8, bottom=0.05, left=0.01, right=0.99)
deprecated_cmaps = ['Vega10', 'Vega20', 'Vega20b', 'Vega20c', 'spectral']
m_cmaps = []
for m in plt.cm.datad:
    if not m.endswith("_r") and m not in deprecated_cmaps:
        m_cmaps.append(m)
m_cmaps.sort()

for index, cmap in enumerate(m_cmaps):
    plt.subplot(1, len(m_cmaps) + 1, index + 1)
    plt.imshow(a, cmap=plt.get_cmap(cmap), aspect='auto')
    plt.axis('off')
    plt.title(cmap, fontsize=10, va='bottom', rotation=90)

show()

Total running time of the script: ( 0 minutes 2.640 seconds)
Estimated memory usage: 14 MB