Note
This page is a reference documentation. It only explains the function signature, and not how to use it. Please refer to the user guide for the big picture.
nilearn.plotting.view_surf#
- nilearn.plotting.view_surf(surf_mesh, surf_map=None, bg_map=None, threshold=None, cmap=<matplotlib.colors.LinearSegmentedColormap object>, black_bg=False, vmax=None, vmin=None, symmetric_cmap=True, colorbar=True, colorbar_height=0.5, colorbar_fontsize=25, title=None, title_fontsize=25)[source]#
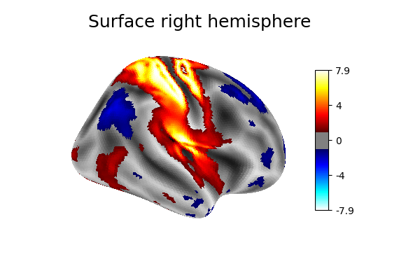
Insert a surface plot of a surface map into an HTML page.
- Parameters
- surf_meshstr or list of two numpy.ndarray
Surface mesh geometry, can be a file (valid formats are .gii or Freesurfer specific files such as .orig, .pial, .sphere, .white, .inflated) or a list of two Numpy arrays, the first containing the x-y-z coordinates of the mesh vertices, the second containing the indices (into coords) of the mesh faces.
- surf_mapstr or numpy.ndarray, optional
Data to be displayed on the surface mesh. Can be a file (valid formats are .gii, .mgz, .nii, .nii.gz, or Freesurfer specific files such as .thickness, .area, .curv, .sulc, .annot, .label) or a Numpy array
- bg_mapSurface data, optional
Background image to be plotted on the mesh underneath the surf_data in greyscale, most likely a sulcal depth map for realistic shading.
- thresholdstr, number or None, optional
If None, no thresholding. If it is a number only values of amplitude greater than threshold will be shown. If it is a string it must finish with a percent sign, e.g. “25.3%”, and only values of amplitude above the given percentile will be shown.
- cmapstr or matplotlib colormap, optional
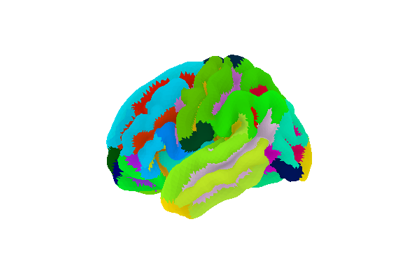
You might want to change it to ‘gnist_ncar’ if plotting a surface atlas. Default=cm.cold_hot.
- black_bgbool, optional
If True, image is plotted on a black background. Otherwise on a white background. Default=False.
- symmetric_cmapbool, optional
Make colormap symmetric (ranging from -vmax to vmax). Set it to False if you are plotting a surface atlas. Default=True.
- vmaxfloat or None, optional
upper bound for the colorbar. if None, use the absolute max of the brain map.
- vminfloat or None, optional
min value for mapping colors. If symmetric_cmap is True, vmin is always equal to -vmax and cannot be chosen. If symmetric_cmap is False, vmin defaults to the min of the image, or 0 when a threshold is used.
- colorbarbool, optional
Add a colorbar or not. Default=True.
- colorbar_heightfloat, optional
Height of the colorbar, relative to the figure height. Default=0.5.
- colorbar_fontsizeint, optional
Fontsize of the colorbar tick labels. Default=25.
- titlestr, optional
Title for the plot.
- title_fontsizeint, optional
Fontsize of the title. Default=25.
- Returns
- SurfaceViewplot of the stat map.
It can be saved as an html page or rendered (transparently) by the Jupyter notebook. Useful methods are :
‘resize’ to resize the plot displayed in a Jupyter notebook
‘save_as_html’ to save the plot to a file
‘open_in_browser’ to save the plot and open it in a web browser.
See also
nilearn.plotting.view_img_on_surfSurface plot from a 3D statistical map.