Note
This page is a reference documentation. It only explains the function signature, and not how to use it. Please refer to the user guide for the big picture.
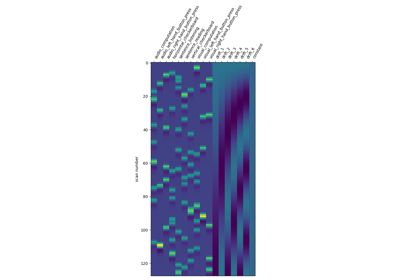
nilearn.plotting.plot_contrast_matrix#
- nilearn.plotting.plot_contrast_matrix(contrast_def, design_matrix, colorbar=False, ax=None, output_file=None)[source]#
Creates plot for contrast definition.
- Parameters
- contrast_def
strornumpy.ndarrayof shape (n_col), orlistofstr, ornumpy.ndarrayof shape (n_col) where
n_colis the number of columns of the design matrix, (one array per run). If only one array is provided when there are several runs, it will be assumed that the same contrast is desired for all runs. The string can be a formula compatible withpandas.DataFrame.eval. Basically one can use the name of the conditions as they appear in the design matrix of the fitted model combined with operators +- and combined with numbers with operators +-*/.- design_matrix
pandas.DataFrame Design matrix to use.
- colorbar
bool, optional If
True, display a colorbar on the right of the plots. Default=False.- ax
matplotlib.axes.Axes, optional Axis on which to plot the figure. If None, a new figure will be created.
- output_file
str, or None, optional The name of an image file to export the plot to. Valid extensions are .png, .pdf, .svg. If
output_fileis not None, the plot is saved to a file, and the display is closed.
- contrast_def
- Returns
- ax
matplotlib.axes.Axes Figure object.
- ax
Examples using nilearn.plotting.plot_contrast_matrix#
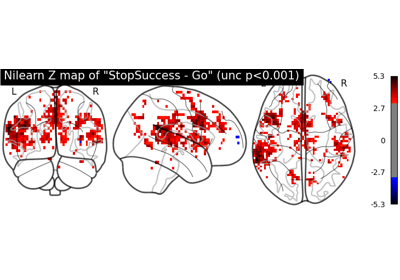
First level analysis of a complete BIDS dataset from openneuro