Note
This page is a reference documentation. It only explains the function signature, and not how to use it. Please refer to the user guide for the big picture.
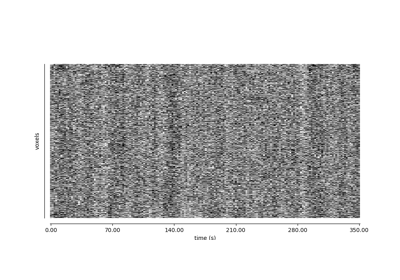
nilearn.plotting.plot_carpet#
- nilearn.plotting.plot_carpet(img, mask_img=None, mask_labels=None, t_r=None, detrend=True, output_file=None, figure=None, axes=None, vmin=None, vmax=None, title=None, cmap='gray', cmap_labels=<matplotlib.colors.LinearSegmentedColormap object>)[source]#
Plot an image representation of voxel intensities across time.
This figure is also known as a “grayplot” or “Power plot”.
- Parameters
- imgNiimg-like object
See input-output. 4D image.
- mask_imgNiimg-like object or None, optional
Limit plotted voxels to those inside the provided mask (default is None). If a 3D atlas is provided, voxels will be grouped by atlas value and a colorbar will be added to the left side of the figure with atlas labels. If not specified, a new mask will be derived from data. See http://nilearn.github.io/manipulating_images/input_output.html.
- mask_labels
dict, optional If
mask_imgcorresponds to an atlas, then this dictionary maps values from themask_imgto labels. Dictionary keys are labels and values are values within the atlas.- t_r
floator None, optional Repetition time, in seconds (sampling period). Set to
Noneif not provided. Default=None.Note
If
t_ris not provided, it will be inferred fromimg’s header (img.header.get_zooms()[-1]).New in version 0.9.1.dev: Prior to this,
t_rwould be inferred fromimgwithout user input.- detrend
bool, optional Detrend and z-score the data prior to plotting. Default=True.
- output_file
str, or None, optional The name of an image file to export the plot to. Valid extensions are .png, .pdf, .svg. If
output_fileis not None, the plot is saved to a file, and the display is closed.- figure
int, ormatplotlib.figure.Figure, or None, optional Matplotlib figure used or its number. If
Noneis given, a new figure is created.- axes
matplotlib.axes.Axes, or 4 tupleoffloat: (xmin, ymin, width, height), optional The axes, or the coordinates, in matplotlib figure space, of the axes used to display the plot. If
None, the complete figure is used.- vmin
float, optional Lower bound of the colormap. If
None, the min of the image is used. Passed tomatplotlib.pyplot.imshow.- vmax
float, optional Upper bound of the colormap. If
None, the max of the image is used. Passed tomatplotlib.pyplot.imshow.- title
str, or None, optional The title displayed on the figure. Default=None.
- cmap
matplotlib.colors.Colormap, orstr, optional The colormap to use. Either a string which is a name of a matplotlib colormap, or a matplotlib colormap object.
Default=`gray`.
- cmap_labels
matplotlib.colors.Colormap, orstr, optional If
mask_imgcorresponds to an atlas, then cmap_labels can be used to define the colormap for coloring the labels placed on the side of the carpet plot.Default=`plt.cm.gist_ncar`.
- Returns
- figure
matplotlib.figure.Figure Figure object with carpet plot.
- figure
Notes
This figure was originally developed in 1.
In cases of long acquisitions (>800 volumes), the data will be downsampled to have fewer than 800 volumes before being plotted.
References
- 1
Jonathan D. Power. A simple but useful way to assess fmri scan qualities. NeuroImage, 154:150–158, 2017. Cleaning up the fMRI time series: Mitigating noise with advanced acquisition and correction strategies. URL: https://www.sciencedirect.com/science/article/pii/S1053811916303871, doi:https://doi.org/10.1016/j.neuroimage.2016.08.009.