Note
Click here to download the full example code or to run this example in your browser via Binder
Massively univariate analysis of a calculation task from the Localizer dataset#
This example shows how to use the Localizer dataset in a basic analysis. A standard Anova is performed (massively univariate F-test) and the resulting Bonferroni-corrected p-values are plotted. We use a calculation task and 20 subjects out of the 94 available.
The Localizer dataset contains many contrasts and subject-related variates. The user can refer to the plot_localizer_mass_univariate_methods.py example to see how to use these.
Note
If you are using Nilearn with a version older than 0.9.0,
then you should either upgrade your version or import maskers
from the input_data module instead of the maskers module.
That is, you should manually replace in the following example all occurrences of:
from nilearn.maskers import NiftiMasker
with:
from nilearn.input_data import NiftiMasker
# Author: Virgile Fritsch, <virgile.fritsch@inria.fr>, May. 2014
import numpy as np
import matplotlib.pyplot as plt
from nilearn import datasets
from nilearn.maskers import NiftiMasker
from nilearn.image import get_data
Load Localizer contrast
n_samples = 20
localizer_dataset = datasets.fetch_localizer_calculation_task(
    n_subjects=n_samples, legacy_format=False
)
tested_var = np.ones((n_samples, 1))
Mask data
nifti_masker = NiftiMasker(
    smoothing_fwhm=5,
    memory='nilearn_cache', memory_level=1)  # cache options
cmap_filenames = localizer_dataset.cmaps
fmri_masked = nifti_masker.fit_transform(cmap_filenames)
Anova (parametric F-scores)
from sklearn.feature_selection import f_regression
_, pvals_anova = f_regression(fmri_masked, tested_var,
                              center=False)  # do not remove intercept
pvals_anova *= fmri_masked.shape[1]
pvals_anova[np.isnan(pvals_anova)] = 1
pvals_anova[pvals_anova > 1] = 1
neg_log_pvals_anova = - np.log10(pvals_anova)
neg_log_pvals_anova_unmasked = nifti_masker.inverse_transform(
    neg_log_pvals_anova)
/home/alexis/miniconda3/envs/nilearn/lib/python3.10/site-packages/sklearn/utils/validation.py:1111: DataConversionWarning:

A column-vector y was passed when a 1d array was expected. Please change the shape of y to (n_samples, ), for example using ravel().
Visualization
from nilearn.plotting import plot_stat_map, show
# Various plotting parameters
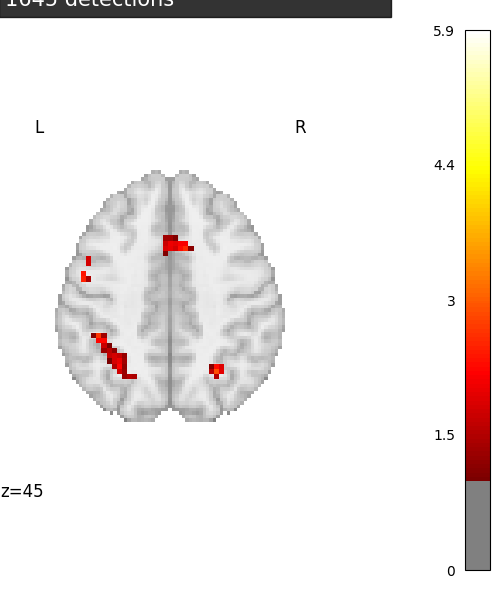
z_slice = 45 # plotted slice
threshold = - np.log10(0.1) # 10% corrected
# Plot Anova p-values
fig = plt.figure(figsize=(5, 6), facecolor='w')
display = plot_stat_map(neg_log_pvals_anova_unmasked,
threshold=threshold,
display_mode='z', cut_coords=[z_slice],
figure=fig)
masked_pvals = np.ma.masked_less(get_data(neg_log_pvals_anova_unmasked),
threshold)
title = ('Negative $\\log_{10}$ p-values'
'\n(Parametric + Bonferroni correction)'
'\n%d detections' % (~masked_pvals.mask).sum())
display.title(title, y=1.1, alpha=0.8)
show()
Total running time of the script: ( 0 minutes 7.197 seconds)
Estimated memory usage: 9 MB