Note
Click here to download the full example code or to run this example in your browser via Binder
Plotting tools in nilearn#
Nilearn comes with a set of plotting functions for easy visualization of Nifti-like images such as statistical maps mapped onto anatomical images or onto glass brain representation, anatomical images, functional/EPI images, region specific mask images.
See Plotting brain images for more details.
Retrieve data from nilearn provided (general-purpose) datasets#
from nilearn import datasets

# haxby dataset to have EPI images and masks
haxby_dataset = datasets.fetch_haxby()

# print basic information on the dataset
print('First subject anatomical nifti image (3D) is at: %s' %
      haxby_dataset.anat[0])
print('First subject functional nifti image (4D) is at: %s' %
      haxby_dataset.func[0])  # 4D data

haxby_anat_filename = haxby_dataset.anat[0]
haxby_mask_filename = haxby_dataset.mask_vt[0]
haxby_func_filename = haxby_dataset.func[0]

# one motor contrast map from NeuroVault
motor_images = datasets.fetch_neurovault_motor_task()
stat_img = motor_images.images[0]
First subject anatomical nifti image (3D) is at: /home/alexis/nilearn_data/haxby2001/subj2/anat.nii.gz
First subject functional nifti image (4D) is at: /home/alexis/nilearn_data/haxby2001/subj2/bold.nii.gz
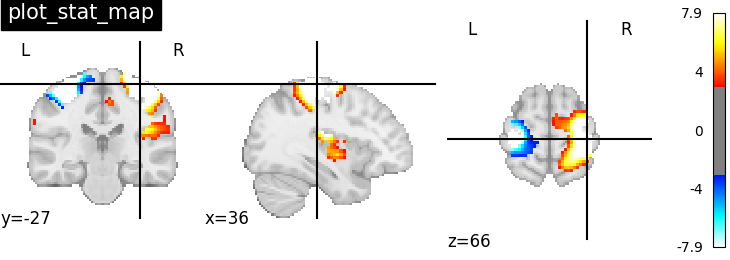
Plotting statistical maps with function plot_stat_map#
from nilearn import plotting

# Visualizing t-map image on EPI template with manual
# positioning of coordinates using cut_coords given as a list
plotting.plot_stat_map(stat_img,
                       threshold=3, title="plot_stat_map",
                       cut_coords=[36, -27, 66])
<nilearn.plotting.displays._slicers.OrthoSlicer object at 0x7ff8ed568400>
Making interactive visualizations with function view_img#
An alternative to nilearn.plotting.plot_stat_map is to use
nilearn.plotting.view_img that gives more interactive
visualizations in a web browser. See Interactive visualization of statistical map slices
for more details.
view = plotting.view_img(stat_img, threshold=3)
# In a Jupyter notebook, if ``view`` is the output of a cell, it will
# be displayed below the cell
view
# uncomment this to open the plot in a web browser:
# view.open_in_browser()
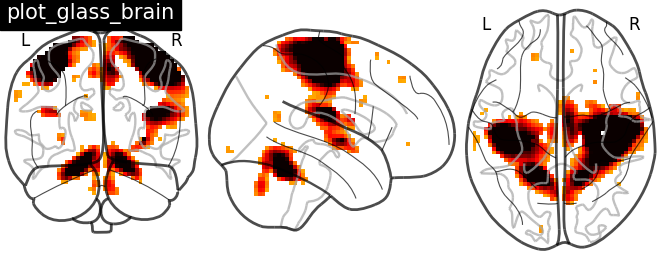
Plotting statistical maps in a glass brain with function plot_glass_brain#
Now, the t-map image is mapped on glass brain representation where glass brain is always a fixed background template
plotting.plot_glass_brain(stat_img, title='plot_glass_brain',
                          threshold=3)
<nilearn.plotting.displays._projectors.OrthoProjector object at 0x7ff8fad8f250>
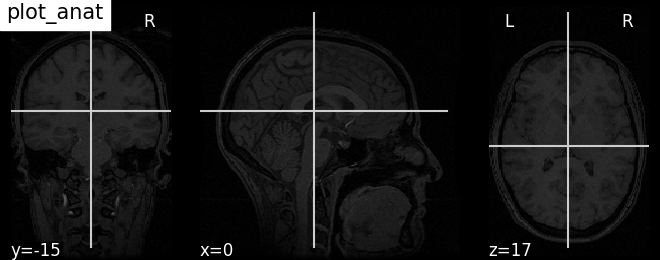
Plotting anatomical images with function plot_anat#
Visualizing anatomical image of haxby dataset
plotting.plot_anat(haxby_anat_filename, title="plot_anat")
<nilearn.plotting.displays._slicers.OrthoSlicer object at 0x7ff8f2b6f220>
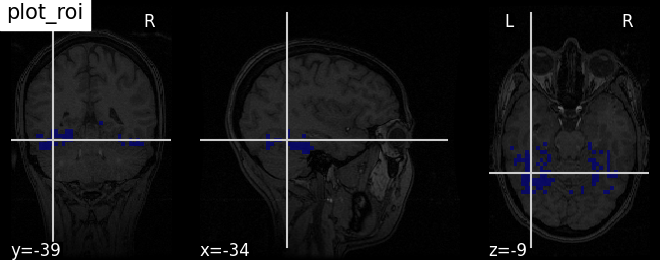
Plotting ROIs (here the mask) with function plot_roi#
Visualizing ventral temporal region image from haxby dataset overlaid on subject specific anatomical image with coordinates positioned automatically on region of interest (roi)
plotting.plot_roi(haxby_mask_filename, bg_img=haxby_anat_filename,
                  title="plot_roi")
<nilearn.plotting.displays._slicers.OrthoSlicer object at 0x7ff8ed56b160>
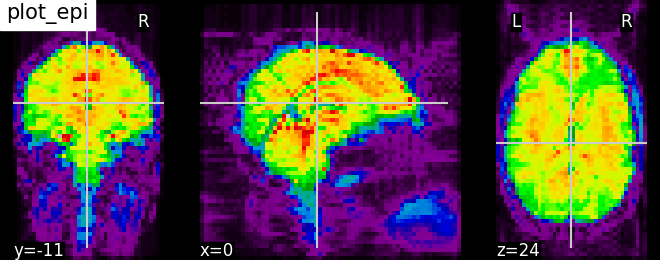
Plotting EPI image with function plot_epi#
# Import image processing tool
from nilearn import image

# Compute the voxel_wise mean of functional images across time.
# Basically reducing the functional image from 4D to 3D
mean_haxby_img = image.mean_img(haxby_func_filename)

# Visualizing mean image (3D)
plotting.plot_epi(mean_haxby_img, title="plot_epi")
<nilearn.plotting.displays._slicers.OrthoSlicer object at 0x7ff8f2a20910>
A call to plotting.show is needed to display the plots when running in script mode (ie outside IPython)
Total running time of the script: ( 0 minutes 15.210 seconds)
Estimated memory usage: 920 MB