Note
Click here to download the full example code or to run this example in your browser via Binder
Visualizing Megatrawls Network Matrices from Human Connectome Project#
This example shows how to fetch network matrices data from HCP beta-release of the Functional Connectivity Megatrawl project.
See nilearn.datasets.fetch_megatrawls_netmats documentation for more details.
Fetching the Megatrawls Network matrices#
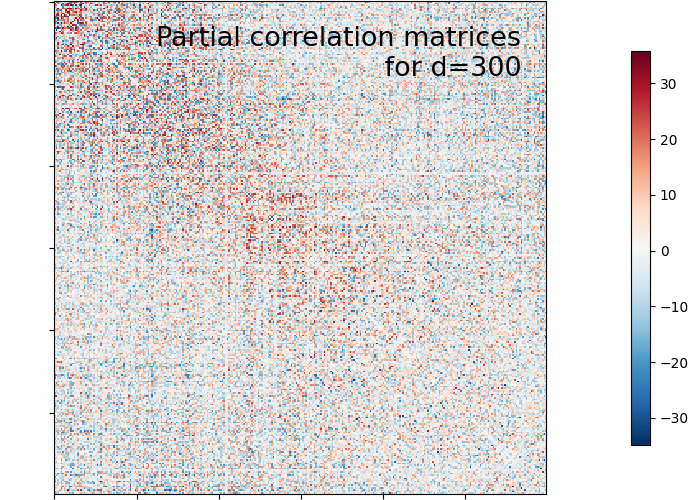
Fetching the partial correlation matrices of dimensionality d=300 with timeseries method ‘eigen regression’
from nilearn import datasets

netmats = datasets.fetch_megatrawls_netmats(dimensionality=300,
                                            timeseries='eigen_regression',
                                            matrices='partial_correlation')
# Partial correlation matrices array of size (300, 300) are stored in the name
# of 'correlation_matrices'
partial_correlation = netmats.correlation_matrices
Visualization#
Import nilearn plotting modules to use its utilities for plotting correlation matrices
from nilearn import plotting

title = "Partial correlation matrices\n for d=300"
display = plotting.plot_matrix(partial_correlation, colorbar=True,
                               title=title)
plotting.show()
Total running time of the script: ( 0 minutes 0.590 seconds)
Estimated memory usage: 9 MB