Note
This page is a reference documentation. It only explains the function signature, and not how to use it. Please refer to the user guide for the big picture.
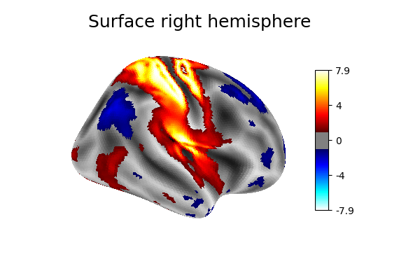
nilearn.plotting.plot_img_on_surf#
- nilearn.plotting.plot_img_on_surf(stat_map, surf_mesh='fsaverage5', mask_img=None, hemispheres=['left', 'right'], inflate=False, views=['lateral', 'medial'], output_file=None, title=None, colorbar=True, vmax=None, threshold=None, cmap='cold_hot', **kwargs)[source]#
Convenience function to plot multiple views of plot_surf_stat_map in a single figure. It projects stat_map into meshes and plots views of left and right hemispheres. The views argument defines the views that are shown. This function returns the fig, axes elements from matplotlib unless kwargs sets and output_file, in which case nothing is returned.
- Parameters
- stat_mapstr or 3D Niimg-like object
See http://nilearn.github.io/manipulating_images/input_output.html
- surf_meshstr, dict, or None, optional
If str, either one of the two: ‘fsaverage5’: the low-resolution fsaverage5 mesh (10242 nodes) ‘fsaverage’: the high-resolution fsaverage mesh (163842 nodes) If dict, a dictionary with keys: [‘infl_left’, ‘infl_right’, ‘pial_left’, ‘pial_right’, ‘sulc_left’, ‘sulc_right’], where values are surface mesh geometries as accepted by plot_surf_stat_map. Default=’fsaverage5’.
- mask_imgNiimg-like object or None, optional
The mask is passed to vol_to_surf. Samples falling out of this mask or out of the image are ignored during projection of the volume to the surface. If
None, don’t apply any mask.- inflatebool, optional
If True, display images in inflated brain. If False, display images in pial surface. Default=False.
- viewslist of strings, optional
A list containing all views to display. The montage will contain as many rows as views specified by display mode. Order is preserved, and left and right hemispheres are shown on the left and right sides of the figure. Default=[‘lateral’, ‘medial’].
- hemisphereslist of
str, optional Hemispheres to display. Default=[‘left’, ‘right’].
- output_file
str, or None, optional The name of an image file to export the plot to. Valid extensions are .png, .pdf, .svg. If
output_fileis not None, the plot is saved to a file, and the display is closed.- title
str, or None, optional The title displayed on the figure. Default=None.
- colorbar
bool, optional If
True, display a colorbar on the right of the plots.Note
This function uses a symmetric colorbar for the statistical map.
Default=True.
- vmax
float, optional Upper bound of the colormap. If
None, the max of the image is used. Passed tomatplotlib.pyplot.imshow.- thresholda number, None, or ‘auto’, optional
If
Noneis given, the image is not thresholded. If a number is given, it is used to threshold the image: values below the threshold (in absolute value) are plotted as transparent. If ‘auto’ is given, the threshold is determined magically by analysis of the image.- cmap
matplotlib.colors.Colormap, orstr, optional The colormap to use. Either a string which is a name of a matplotlib colormap, or a matplotlib colormap object. Default=’cold_hot’.
- kwargsdict, optional
keyword arguments passed to plot_surf_stat_map.
See also
nilearn.datasets.fetch_surf_fsaverageFor surface data object to be used as the default background map for this plotting function.
nilearn.surface.vol_to_surfFor info on the generation of surfaces.
nilearn.plotting.plot_surf_stat_mapFor info on kwargs options accepted by plot_img_on_surf.